Testimony on Pesticide
Pricing
Prepared For The U.S. House of Representatives
Committee on Agriculture, Washington, D.C.
By Kenneth McEwan, Ridgetown College, University of Guelph
1.0
Introduction
Pesticides are a
major farm input with many commercial cash crop operations spending 5% - 15% of
cash operating expenses on these products. As global competition in agricultural
markets has increased, competitiveness in input pricing has received more
attention. The stimulus for the recent study APesticide Price Differentials Between
Canada and the U.S.@ was raised out of concerns brought forward
by farmers in North Dakota and Minnesota that prices for identical pesticide
products were higher in the U.S. than in Canada. This is not a new problem.
About ten years ago similar concerns were expressed by Canadian farmers and this
potential disadvantage was recognized by the Task Force on Competitiveness in
the Agri-Food Industry. This difference in pesticide pricing between Canada
and the U.S. for similar products has been reported at other national border
crossing points e.g. Ontario vs Great Lake States (McEwan, 1996).
The U.S. is normally
ranked 1st with close to 30% of the global market share for pesticide
sales while Canada typically represents 2% to 3% and ranks 8th or
9th. The U.S. has many large acreage crops and several with high
chemical demands. From a manufacturers perspective, this means the U.S. receives
considerable attention and has significant impact when determining new product
registrations. U.S. crops normally thought to influence a
manufacturer=s decision making are: corn, soybeans,
cotton, peanuts, and many of the specialty horticulture crops. The large acreage
crops in Canada are wheat, barley and canola and are grown using extensive
agricultural practices i.e. low input use. Market size and product demand are
important factors when determining product price, since pesticide pricing is not
cost based but determined according to what the market will bear.
2.0
Economic Theory
The traditional
economic models used to describe competition i.e. pure or perfect, and the
derivative models of monopoly, duopoly and oligopoly, do not necessarily work
very well when applied to the real world. These models have failed for a variety
of reasons and two of these are: the requirement for detailed knowledge about
cost structures of firms; and the lack of guidance to define the boundaries of a
market or an industry.
Economic models that
appear to have more relevance to the pesticide industry are the ones which
suggest that competition is a process and that firms compete on more than just
price. These models emphasize the importance of barriers to entry into the
industry and place little relevancy on the number of firms serving a particular
market. Competition is defined as the ability of firms to discover the
preferences of their customers, the capabilities of their rivals, the ability to
innovate, to differentiate their products, to price cut, ability to advertise,
and to develop personal relationships with buyers or sellers to enhance good
will and reputation.
Further, there has
been some economic work which suggests that farmers are sometimes irrational in
their pesticide use decisions and are not necessarily profit maximizers. This
piece of theory supports the notion that competition for pesticides is likely to
be expressed in several dimensions other than simply price.
There are several
theoretical explanations that allow one to understand the reasons why prices may
vary from one geographic location to another. The most relevant explanations
include:
i)
the case where prices of similar pesticide products differ as a result of
differences in the demand (the farmer=s willingness to pay) for the pesticides in
the two countries;
ii) the
case where prices of similar pesticide products differ as a result of
differences in costs that arise due to the variation in the size of the market
and other delivery and sales factors in the two countries;
iii) the
case where prices of similar pesticide products differ as a result of the
ability to segment markets due to differences in demand (particularly those
related to the availability of substitute formulations) in the two countries;
and
iv) the case
where prices of similar pesticide products differ as a result of different
patent and/or registration requirements in the two countries.
In conclusion, this theoretical background on
competition and why prices are likely to differ between regions provides a
framework from which to examine differing pesticide prices. In general, it would
appear that manufacturers view the pesticide market as having an inelastic
demand curve, thus cutting price is not going to maximize total revenue, rather
product differentiation (i.e. what new innovation it brings to the market e.g.
crop safety), personal relationship, and service will add to profits.
3.0
An Overview of Pesticide Pricing in Canada
It is the
manufacturers that decide on how best to position the pesticide in the market
place. The pricing of the product is influenced only marginally on costs of
production, rather it is estimating what value the product brings to the target
market, what share of the target market can be captured, and assessing the level
of riskiness associated with the products that play greater roles of importance.
Price determination by the manufacturers involves the use of
strengths/weaknesses/opportunities/threats analysis, focus groups, market
research and market value assessment to determine the value of the pesticide to
the grower. The challenge for the manufacturer is to assess the value and
establish an appropriate price relative to similar products being sold. The
higher the value the higher the price. The lower the value the lower the price.
In minor markets, the pesticide typically assumes the price established in the
major markets, unless the pesticide can be differentiated based on formulation
or some other difference.
However, there are
exceptions to this methodology of establishing price, with Roundup being
an example. With Roundup, price is established based on a price volume
relationship that is established through extensive market research. Volume is
set to maximize marginal revenues across all markets. Monsanto uses this pricing
strategy even though the patent for Roundup has expired, and even though
virtually identical competitive products exist (i.e. Touchdown and Glyfos).
Several factors enable Monsanto to use this strategy. First, the market for
Roundup is expanding and this expansion is being driven primarily by Monsanto
e.g. transgenic crops. Second, Monsanto has strength in the supply chain because
of their strategy to expand markets and because of brand loyalty at the grower
level. Due to these two factors, distributors and retailers may hesitate to
jeopardize their position with Roundup if they were to carry the competing
products, Touchdown or Glyfos.
As an industry
benchmark, most manufacturers try to achieve about 15% return on investment. The
margins (defined as retail selling price minus product expenses divided by
retail selling price) received by manufacturers for specific products are
confidential but the industry range is normally thought to be between 20% to
50%. It is possible for a product to have a high margin and still not be
profitable because of high research and development costs.
Manufacturers
try to influence price at the retail and distributor level by using programs -
incentives for performance. On average, the total value of the programs at both
the distributor and retailer level is about 15% to 20% of the invoiced price.
Typical components of the programs are: sales performance; early order; early
take; central service rebates; business planning; and specialty training.
Pricing at the distributor level is determined by taking the retail price and
subtracting off the retail margin. There are many factors that affect the price
manufacturers charge distributors for pesticides and some of these are: ability
to warehouse; payment terms; able to supply timely reports and amount of market
coverage. Normal margins at the distributor level are 2% to 15%. Distributor
margins tend to be higher for new products and for minor
products.
Pesticides at the
retail level are also on a cost plus margin basis. Retailers are expected to
price according to local conditions and the level of competition in the area.
Typical factors affecting a dealer=s cost are: cash; volume; time of
purchasing; previous performance and nature of the relationship. Increasingly,
retailers are trying to differentiate themselves in the market place and
increase profitability in handling pesticides by providing more services e.g.
custom application. In general, retailers have a two price system
depending on the volume being purchased. Cash discounts and volume discounts are
frequently used and are normally valued at about 2% of gross sales.
In 1997 when Western
Canadian retailers were asked about the competitiveness at the retail level
amongst prairie provinces, the ranking was Alberta, Manitoba, and then
Saskatchewan. Reasons given for this were: higher valued crops grown in Alberta
and Manitoba thus more likely to invest more in pesticides on a per acre basis;
and a significant portion of Saskatchewan is fallow, farmers especially in the
dryland regions tend to be very cautious on input purchasing i.e. will only
spend $C3 or $C5 per acre on pesticides as compared to $C15 or $C20 on
more intensely cropped lands. Further, another influence on the prices paid for
pesticides is farmer buying practices. Increasingly, buying groups are being
formed and make the decision to purchase solely on prices, no services, and no
credit terms.
This description of how manufacturers set price fits
very well with the previous economic theory discussed. It appears that
manufacturers view pesticides as having an inelastic demand curve, and that
cutting price is not going to maximize total revenue rather product
differentiation i.e. what new technology it brings to the market (e.g. less
residue), personal relationship, and service will add to profits. Distributor
and retail margins can be seen below in Table 1.
Table 1:
Summary of Distributor and Retail Margins by Product for Western and Eastern
Canada
Manufacturer
Product
Product
Distributor
Dealer Margin Suggested Margin
Total
Name
Size
Cost
Cost
% Retail
% Margin
1.
AgrEvo
Liberty
--
--
--
--
--
--
N/A
2.
Cyanamid
Pursuit
33
litre
649.32
687.57
5.56
735.58
6.5 12.06
3.
Monsanto
RoundUp
10
litre
81.17
83.10
2.32
89.85
7.5 9.82
4.
Dow/Elanco 2,4-D Amine
500 10
litre
49.13
52
5.52
65.5
20.6 26.12*
5.
Novartis
Dual
II
10
litre
--
—
—
--
—
N/A
6.
BASF
Banvel
480
10
litre
266.19
277.1
3.94
320
13.4 17.34
7.
Bayer
Furadan
480
4
litre
--
—
—
--
—
N/A
8.
Bayer
Admire240
FS
3.785
litre
--
—
—
--
—
N/A
9.
Rhone-Poulenc
Select
--
--
--
--
--
--
N/A
10.
Zeneca
Achieve-80DG
2
litre
291.86
306.75
4.85
348.5 12.0
16.85
Source:
A Review of Agricultural Pesticide Pricing and Availability in Canada,
1997
* 2,4-D increased in 1997
4.0
Pesticide Price Comparisons With Other Countries
The following
discussion is based on results found by the Prices Surveillance Authority in
Australia completed in 1993. This report is relevant to any discussion on
different pesticide prices between various jurisdictions for a variety of
reasons. It clearly documents similar products having different prices in
various countries despite free trade existing. Further, the study breaks
down pesticide costs by component.
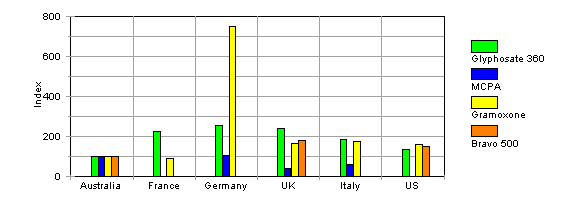
The report compared international pesticide pricing and
showed substantial differences in prices across countries and products as
illustrated in Figure 1. For reasons given in the study individual country
markets are in effect largely insulated one from the other even though free
trade may exist. As a result the farm chemical industry at a global level is not
a competitive industry with respect to prices. The reasons for this include
differences in labeling regulations, regulatory requirements, formulations and
timing of growing seasons. While Australian firms do compete, the majority
of their products are sufficiently differentiated for
firms to be able to be price makers not price takers.
Such differentiation can occur from a natural source (resistance, seasonal
factors) or from value-added delivery systems.
Figure 1: Overseas Price Index
Comparison
Source: Price Surveillance Authority,
1993
The Price
Surveillance Authority also undertook the task of surveying manufacturers to
analyze costs associated with supplying chemical to farmers. At the
manufacturers level it was found that active ingredient accounted for 55.2% of
the wholesale price for locally formulated products. Other key items
contributing to cost are marketing and sales expenses- 12.9%; packaging - 2.7%;
and net profit margin - 6.8%. A complete accounting of costs associated with
farm chemicals is depicted in Table 2.
Table 2:
Composition of Costs Associated with the Supply of Farm
Chemicals
Cost Category
|
Percent of Ex-Factory Sale
Price |
|
|
Local |
Imported |
|
Active ingredient/Cost of formulated
import |
55.2 |
59.9 |
|
Operating expenses |
1.0 |
0.0 |
|
Other manufacturing costs |
6.3 |
2.2 |
|
National R&D component |
1.8 |
0.3 |
|
Packaging |
2.7 |
1.8 |
|
Marketing/Sales |
12.9 |
10.7 |
|
Warehousing |
1.1 |
2.4 |
|
Distribution |
2.5 |
2.0 |
|
Logistics and admin |
5.2 |
4.3 |
|
Interest and credit provision |
1.6 |
1.1 |
|
Royalties, license fees, etc. |
0.6 |
1.6 |
|
Maintenance of registration on
active |
1.4 |
2.3 |
|
Other costs (rebate) |
1.0 |
0.1 |
|
Net profit margin |
6.8 |
5.7 |
|
Total (ex factory sale
price) |
100.00 |
100.00 |
Source: Prices Surveillance Authority,
1993
The Australian
report concluded that pesticide pricing is not cost based but determined
according to what the market will bear. Farmers in whichever country needing the
chemical the most and exhibiting a higher willingness to pay, are charged the
highest prices.
5.0
Pesticide Price Comparisons Between Manitoba and North
Dakota/Minnesota
Table 3 depicts the
% difference in pesticide prices between Manitoba and North Dakota/Minnesota
from 1994 to 1999. From this table it is possible to see several products higher
priced in North Dakota/Minnesota relative to Manitoba. Notable products with a
higher price include: Liberty, Lontrel/Stinger, Roundup Original/Ultra, Avenge,
BuctrilM/Bronate, Hoe Grass/Hoelon, Pardner/Buctril, and Puma. There are
products lower priced in North Dakota and a couple of examples are Furadan and
Malathion. Notice that many of these price differences have existed for some
time and in general there has been little change in the size of the price
difference over the study period.
Table 3: The Per Cent Difference in
Price for Selected Pesticides Between Manitoba and North
Dakota/Minnesota
|
Herbicides |
Crop |
1994 |
1995 |
1996 |
1997 |
1998 |
1999 |
Avg %
Difference
All
Years |
|
Atrazine
Liquid |
none |
|
‑7.3 |
‑12.9 |
|
|
11.8 |
‑2.80 |
|
Edge 5G/Sonalan
10G |
Canola |
|
|
|
|
|
10.1 |
10.10 |
|
Liberty |
Canola |
|
|
|
|
|
‑39.6 |
‑39.60 |
|
Assure ‑ Assure
II |
Canola/Potatoes |
|
|
|
|
|
‑10.6 |
‑10.60 |
|
Poast &
Ultra/Poast |
Canola/Potatoes |
|
‑3.4 |
38.9 |
29.4 |
17.0 |
33.5 |
23.08 |
|
Fortress/Buckle |
Canola/Wheat/Barley |
|
|
|
|
|
‑13.1 |
‑13.10 |
|
Lontrel/Stinger |
Canola/Wheat/Barley |
|
|
|
|
|
‑28.5 |
‑28.50 |
|
Rival/Treflan Trifluralin 99
EC |
Canola/Wheat/Barley |
‑4.4 |
‑2.6 |
3.8 |
1.2 |
‑3.1 |
|
‑1.02 |
|
Rival/Treflan Trifluralin 99
EC |
Canola/Wheat/Barley |
‑4.4 |
‑2.6 |
3.8 |
1.2 |
‑3.1 |
|
‑1.02 |
|
Roundup
Original‑Transorb/Ultra |
Canola/Wheat/Barley |
‑40.0 |
‑45.9 |
‑46.0 |
|
‑55.3 |
‑39.1 |
‑45.26 |
|
Roundup Transorb/Ultra RT
Bulk |
Canola/Wheat/Barley |
|
|
|
|
|
‑26.9 |
‑26.90 |
|
Treflan
QR5‑Granular‑TR10 |
Canola/Wheat/Barley |
‑3.1 |
3.5 |
8.3 |
4.1 |
|
14.5 |
5.46 |
|
Eptam 8‑E/Eptam
7‑E |
Potatoes |
|
|
|
|
|
‑14.9 |
‑14.90 |
|
2,4‑D
Amine |
Wheat/Barley |
‑11.1 |
‑1.9 |
‑4.1 |
‑2.3 |
‑15.0 |
‑2.6 |
‑6.17 |
|
2,4‑DLV
Ester |
Wheat/Barley |
|
|
|
|
|
36.6 |
36.60 |
|
Assert 300‑SC/Assert
2.5S |
Wheat/Barley |
|
|
|
|
|
‑12.7 |
‑12.70 |
|
Avadex/Far‑Go
EC |
Wheat/Barley |
‑24.7 |
‑24.9 |
‑24.3 |
‑28.9 |
‑25.3 |
‑41.6 |
‑28.28 |
|
Avadex/Far‑Go
G |
Wheat/Barley |
‑2.5 |
‑9.3 |
‑5.5 |
‑8.5 |
‑5.1 |
‑10.0 |
‑6.82 |
|
Avenge |
Wheat/Barley |
‑30.8 |
‑24.0 |
‑23.4 |
‑29.5 |
‑28.7 |
‑26.9 |
‑27.22 |
|
Banvel |
Wheat/Barley |
2.2 |
5.9 |
5.2 |
|
‑1.0 |
3.2 |
3.10 |
|
Basagran |
Wheat/Barley |
|
|
|
|
|
‑0.7 |
‑0.70 |
|
Buctril
M/Bronate |
Wheat/Barley |
‑45.6 |
‑42.3 |
‑32.9 |
‑31.1 |
‑30.3 |
‑26.7 |
‑34.82 |
|
Curtail
M |
Wheat/Barley |
|
|
|
|
|
‑15.5 |
‑15.50 |
|
Hoe
Grass/Hoelon |
Wheat/Barley |
‑25.2 |
‑27.0 |
‑27.1 |
‑27.8 |
‑27.6 |
‑27.5 |
‑27.03 |
|
MCPA
Amine |
Wheat/Barley |
‑12.9 |
‑0.8 |
‑5.7 |
‑4.0 |
‑3.2 |
8.7 |
‑2.98 |
|
MCPA
Ester |
Wheat/Barley |
|
|
|
|
|
3.6 |
3.60 |
|
Pardner/Buctril |
Wheat/Barley |
|
|
|
|
|
‑25.0 |
‑25.00 |
|
Puma |
Wheat/Barley |
|
|
|
|
|
‑35.2 |
‑35.20 |
|
Stampede |
Wheat/Barley |
|
|
|
|
|
22.8 |
22.80 |
|
Fungicides |
|
|
|
|
|
|
|
|
|
Dithane
DG/DF |
Potatoes/Wheat |
|
|
|
|
|
2.7 |
2.70 |
|
Tilt |
Wheat/Barley |
|
|
|
|
|
‑11.3 |
‑11.30 |
|
Insecticides |
|
|
|
|
|
|
|
|
|
Furadan |
Canola/Potatoes |
26.8 |
26.2 |
28.1 |
31.6 |
|
|
28.17 |
|
Lorsban |
Canola/Potatoes |
‑8.7 |
‑8.6 |
‑13.4 |
‑7.3 |
‑13.8 |
|
‑10.36 |
|
Malathion |
Canola/Potatoes |
27.8 |
35.3 |
14.7 |
|
12.2 |
|
22.50 |
|
Sevin
XLR |
Canola/Potatoes |
24.3 |
24.0 |
20.8 |
|
12.5 |
|
20.40 |
|
Note:
blank spaces denote prices not available |
|
|
|
|
|
|
|
Source: The Thomsen
Corporation, 1999
When yearly price
changes are examined over the 1993-1999 time period, there are some products
displaying a price decline, but generally most are up 1 to 5% per year. It is
interesting to note that the price of Roundup dropped 10% in 1995 while
Malathion jumped 48% in 1999. Most pesticide products have increased in price
over the 1993 - 1999 period, however there are some exceptions such as MCPA,
Poast, and Trifluralin. As seen in other studies, the Manitoba and North Dakota
pesticide price series also shows that individual product prices do not move in
harmony with each other.
6.0
Pesticide Price Comparisons Between Ontario and Great Lake
States
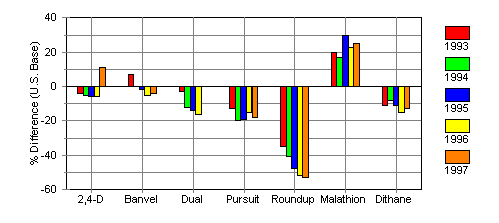
In 1996, Ontario enjoyed significantly lower prices in 7
out of 16 herbicides surveyed including products such as Bladex 90 DF, Dual,
Dual Bulk, Reglone, Roundup, Sencor 75DF and Pardner. Ontario also enjoyed a 15%
price advantage over the Great Lake States for Pursuit, the major soybean
herbicide used in Ontario in 1996 (McEwan, 1997). For insecticides, U.S.
average prices were at minimum 20% lower than Ontario prices for products such
as Furadan 480DF, Malathion 500 EC, and Ambush. Figure 2 depicts pesticide
prices between Ontario and Great Lake States for selected products from 1993 to
1997.
Figure 2: A Comparison of
Pesticide Prices Between Ontario and Great Lake States
Source: McEwan, 1997
7.0
Pesticide Prices Differ Between Prairie Provinces
A comparison of
prices between Alberta and Saskatchewan for 2,4-D Amine illustrates pesticide
prices vary between prices with a higher cost for Saskatchewan producers. On
average, Saskatchewan producers have paid between 2-7% more for 2,4-D amine than
their Alberta counterparts. A couple of reasons for differences in pesticide
prices between neighbouring provinces include greater spatial differences
between dealers in Saskatchewan and products sold in Saskatchewan tend to be low
margin, high volume products thus dealers need additional margin to support
their outlets. Table 4 provides the difference in price as a percent
value.
Table 4:
2,4-D Amine Percent Price
Difference in Saskatchewan Over Alberta, 1995-1997
Survey
Date
% Difference
May,
1995
2.64
April,
1996
7.70
May,
1996
4.65
June,
1996
3.56
October,
1996
4.78
April,
1997
5.77 |
Source: derived from AFRD and Saskatchewan
Agriculture and Food data
8.0 A
Changing And Dynamic Pesticide Market
Pesticide options
available to growers are constantly changing. In the broadleaf, post-emergent
herbicide market for soybeans in Ontario during the 1997 growing year there were
6 herbicides (Pinnacle, Pursuit, Basagran, Blazer, Reflex and Roundup)
representing the involvement of 6 manufacturers. In comparison, in 1990, growers
had only two postemergent broadleaf weed control options. During the 1997
growing year Pursuit dominated this market, however, with the introduction of
Roundup Ready soybeans and Classic, this superiority by Pursuit has been eroded.
9.0 A
Comparison of Fuel, Fertilizer and Pesticides Prices,
1993-1996
In order to compare farm input bundles between Ontario
and Great Lake States, price indices were computed using all the inputs
surveyed within the Ontario Farm Input Monitoring Project (45 products – Table
5). Relative value weights were assigned to each input. The results from a
comparison of average Ontario versus U.S. prices indices (percentage
differences, U.S. base) using the final survey done in each of 1993,1994,1995
and 1996, are found below. Relative to U.S. prices, Ontario combined survey
prices were higher in the final survey of each year, in all four years. At the
end of 1996, the total Ontario input price index was 4.5% higher than the U.S.
index. The major advantage to U.S. producers has been in the fuel category,
while Ontario producers enjoyed relative advantages in overall pesticide prices.
At the end of 1996, U.S. again reported an advantage in overall fertilizer
prices.
Table 5:
Ontario Prices Compared to U.S.
Prices |
|
Final Survey
In: |
|
|
1993
15 Dec |
1994
12 Oct |
1995
13 Dec |
1996
11
Dec |
|
Fuel Index |
18.9% |
19.2% |
17.3% |
12.4% |
|
Fertilizer Index |
3.5% |
2.4% |
0.8% |
7.3% |
|
Pesticides Index |
-8.0% |
-13.2% |
-13.5% |
-13.1% |
|
Total Index |
5.8% |
3.7% |
2.2% |
4.5% |
Caution must be
exercised when interpreting these indices because no farm ever buys all the
products grouped together to develop the index. However, the index does serve as
an indicator of regional price differences.
10.
Summary
There are many
reasons why pesticide prices vary between countries and they include:
differences in patent expiry dates; differences in market size and costs;
differences in pesticide demand (e.g. farmer preferences, willingness to pay);
and differences in the number of substitute products available. The restriction
in the movement of pesticides across borders (i.e. because of labeling,
formulation, name differences, timing of seasons and different regulatory
systems) is one of the basic reasons for expecting to see prices for similar
pesticides to differ between dealers in the U.S. and those in Canada. From a
manufacturer=s perspective, the U.S. and Canada
represent two distinct markets for pesticide sales.